ER Audio ESL Panel Full Test

This blog post features a full test on the ER Audio ESL Panel (Version 4). A customer sent me these panels to test. I wanted to establish a baseline set of measurements for future changes. The customer wants me to investigate any changes that may further improve the speaker's performance.
The kit retails for around $4,200 CAD. I built a wood support frame and wired them up. The kit comes with the step-up transformers and circuitry mounted to a board of wood ready for install. The instructions walk you through the assembly process. It was relatively easy to build.
There isn't much information on the ER Website in terms of specifications. However based on my measurements below you will quickly get a sense of what these can do.
I conducted a full set of electrical and acoustical measurements.
Impedance Sweep
I conducted the impedance sweep with my DATS V2 speaker tester. The ESL-4 panels produced a very unusual impedance sweep. As you can see below the impedance peaks out at 265Hz (33ohms) and dips to only 0.80ohms at 13.4kHz! This caused my amplifier to go into protect mode at any SPL above 90dB.

Frequency Response
Below is the frequency response obtained in my studio using a gating frequency of 300Hz. I noted a sensitivity of 88dB@1w using a 1kHz test tone set to 2V.

For interests sake I removed the gate to see the low frequency extension. Keep in mind that below 300Hz includes the effect of my room with some peaks and dips being introduced into the response.

The peak at 58Hz indicates the main resonance (FS) for the diaphragm. This can be confirmed by tapping on the panel and it rings like a bass drum. This indicates that the panel should be high passed at around 80Hz.
Harmonic Distortion
Harmonic distortion remains extremely low through it's frequency band. The distortion sweep below is with the panel output set to 85dB SPL at 1 meter. Third harmonic is only 0.07% at 2kHz.

Increasing the SPL to 90dB saw no change in distortion. Third harmonic at 80Hz is only 0.158% or -56dB down from the fundamental.

Increasing the SPL to 95dB resulted in my amplifier going into protect mode during the frequency sweep. At 5kHz the amplifier shut down which corresponds to a 1.2ohm load according the impedance sweep shown earlier.

Second harmonic saw and increase during this sweep however I suspect this was amplifier distortion. For reference, my amplifier has an output power of 200watts into 4 ohms.
Intermodulation Distortion (IMD)
I conducted an IMD test at 80dB SPL at 1 meter. The results are shown below. The low decade multiband test tone from 100Hz - 1kHz shows side band products around -53dB down. This equates to around 0.22% IMD.

Raising the SPL to 85dB SPL produces side band products -60dB down at 700Hz which is only 0.10% IMD.

Raising the SPL to 90dB SPL produces even further improvement to -63down (0.07% IMD). This ESL produces some very clean and transparent sound.
I then measured IMD for the treble region which is shown below, starting with a 80dB test signal.
Looking at the upper decade IMD spectra between 1.5kHz to 15kHz sees some very respectable numbers. Side band products at 10kHz are -73dB (.031%IMD).

Raising the SPL again to 85dB saw these numbers get worse. However I strongly suspect that what I'm seeing is amplifier distortion and not distortion from the ESL panel. I know this because my amp went into protect mode when I attempted to raise the test signal for the next test.
IMD distortion at 85dB SPL shown below. The distortion products are likely caused by the amplifier (-65dB at 10kHz 0.056%IMD)

Step Response
Below is the step response for the ESL-4 Panel. The ringing may be due to the undamped diaphragm.

Burst Decay
Below is the burst decay response for the ESL-4 panel.

Off-Axis Frequency Response
Below is the off-axis coloured polar map representing the off-axis frequency response characteristics. The panel has wide coverage (90 degrees listening window) where it quickly starts to narrow starting at 2.5kHz. By 10kHz the listening window has narrowed to only 40 degrees. This is quite narrow. For comparison most of my horns have at least a 90 degree listening window at 10kHz. The smaller horns I offer are even wider at 120 degrees at 15kHz.

Above 2kHz the off-axis is however consistent in nature with the exception of the narrowing effect. This can be observed more clearly with the diagram below. There are no large spikes in the off-axis which would indicated severe edge diffraction.

There is a bit of an off-axis suck-out at 800Hz which may be due to the width of the panel. I plan on mounting a large dipole waveguide in order to control the directivity in the 500Hz-2.5kHz region. This will improve the power response into the room and balance out the perceived midrange and treble relationship (timbre).
Subjective Listening Impressions
Below is a ranking for my subjective impressions on the sound quality...
Soundstage Depth --- 10/10
Soundstage Width --- ?/10 Could not test, I only have one speaker
Smoothness --- 10/10
Coherence between midrange and treble --- 10/10
Vocal Clarity Male --- 10/10
Vocal Clarity Female --- 10/10
Accurate Musical Instrument timbre --- 8/10
Sense of Dynamic Range: --- 9/10
Conclusion
The ESL-4 two panel system offers some very good performance. Soundstage depth, smoothness, and vocal clarity are excellent. I faced some challenges getting the SPL above 90dB at 1 meter. The customer has requested that I look at methods of extracting the best performance from the kit. This blog post establishes a baseline for objective test data.
I plan on conducting these changes to see if the performance can be improved:
- Fully cover front and rear of panel with 12mm thick open cell foam to damp diaphragm
- Dipole horn loading to improve directivity in the midrange
- Consult with manufacturer on low impedance load issue
- Consult with manufacturer on best amplifier
Stay tuned!
Addendum June 26, 2021
I decided to search online to see if there was some comparison measurements with other ESL speakers. Stereophile tested the MartinLogan Masterpiece Renaissance ESL 15A.

The Masterpiece Renaissance produced the following off-axis measurements according to Stereophile.
On-axis (black) and at: 15° (orange), 30° (green), 45° (blue), 60° (magenta), 75° (purple), 90° (turquoise) off axis.

I decided to reproduce the same graph with the ER Audio ESL panels to compare. Below is the result with red (on-axis), green (15 degrees), blue (30 degrees), and black (45 degrees).

The ER Audio ESL has narrower treble coverage compared to the Martin Logan. Looking at the 10kHz region, at 15 degrees off-axis the ER Audio is -6dB down while the Martin Logan is only -0.50dB down. At 30 degrees off axis the ER Audio is -18dB down while the Martin Logan is only -2dB down. This is a significant difference.
Addendum July 13, 2021
I decided to test the effect of adding foam sheets to both the front and rear of the ESL panel. I decided on 1/2" thick (12mm) 30ppi open cell foam so that it would not effect the high frequencies. I use this foam routinely and I'm familiar with it's great damping with very little side effects.
I ran some electrical and acoustical tests to see the effect of the foam.
You can click on the images below to download the PDF version of the sheet.
Frequency Response
Treble Response
The frequency response sees some attenuation in the high frequencies as a result of adding the foam. There is a steep drop in the response starting at 9kHz and it's down -15dB by 15kHz compared to only -7dB by 15kHz.
Bass Response
The foam does help damp the resonant peak at 58Hz. Without the foam the peak hits 103dB@1w. With the foam the resonant peak is damped down to 98dB. This helped with the bass quality. The panel could now be used to reproduce bass frequencies on it's own without the support of a subwoofer. Perhaps the foam should be removed down the middle of the panel to allow the high frequencies to pass through unaffected.
Burst Decay
Changing gears to some time domain measurements sees all around improvement. The burst decay is cleaned up across the spectrum. The ringing is gone in the step response and now looks normal for a wide bandwidth device.

Impedance Sweep
The impedance sweep sees some smoothing as a result of the foam. This can only be a good thing.

Conclusion
I didn't notice any degradation in sound quality with the addition of the foam. I did notice that the high frequency extension suffered however I noticed a distinct improvement in the bass. The solution may be to remove a vertical strip to resolve the high frequencies attenuation issue and hopefully the foam is still effective at improving the bass. If not I may look at 1.4" foam down the middle and even thicker foam down the sides. Either way it appears as though one can fine tune both the frequency and time domain performance to some extent by adding the foam. I decided to omitt distortion measurements from the this test. I'm still trying to establish a standard test procedure. I'm also trying to use the right equipment. The ESL panels have virtually no distortion right up to thier maxiumum SPL of around 90dB SPL@1m. Above this SPL the treble starts to distort very quickly.
Swapping Amplifiers
The ER ESL panel presents a very difficult load to the amplifier. The impedance dips to only 0.8ohm at 12.5kHz. The amplifier I was using would run into protection mode when attempting anything over 90dB SPL in the treble region. Swapping to a more powerful amplifier I decided to use my Yorkville PX1700 which is able to deliver 1700watts and is 2ohm stable. The Yorkville did nothing to resolve the situation. I was not able to achieve even another 3dB with the Yorkville even though I was going from 200watts to 1,700watts. I also observed the same distortion between amplifiers at 90dB SPL leading me to conclude that the panel itself has a SPL output limit of around 90dB. In other words, adding a more powerful amplifier will not make the panel go louder. Also, one may be inclined to add a subwoofer and high pass the panel to achieve higher SPL, however the SPL limit actually comes from the treble region. So if you want to go louder then the only solution is to add a third or fourth panel. Adding two more panels would only increase the maximum SPL from 90dB to 93dB. Which makes me wonder if horn loading a section of the panel is the way to go.
Addendum Oct 2, 2021
I wanted to test the effect of adding a horn to the ESL panel. My customer originally contacted because he wanted to commission me to build a horn for his panels. He provided me with the horn flare geometry in the form of cartesian coordinates that he had been given from another consultant. I advised him that we should build a test horn to confirm performance before investing in the cost of a finished hardwood product. I decided to build a horn from sonotube that was reinforced from behind with ribbing.
Below is the temporary horn pieces used for evaluation. The horn quickly removeable for direct acoustical measurement comparison.

Frequency Response
Below is the frequency response of the ESL panel with no horn.

Adding the horn lens produced the following frequency response.

Overlaying the two responses is shown below. The black line represents the response with the horn.

The addition of the horn provides a sensitivity gain of around 2.5dB starting from 200Hz and below. This is nearly equivalent to doubling your amplifier power.
Harmonic Distortion
Below is the harmonic distortion sweep for no horn. I've set the cursor at 200Hz to show that second harmonic is at 0.52%.

Adding the horn produces the distortion sweep shown below. Distortion at 200Hz is now at 0.48% even with the 2.5dB increase in output. Note though that the third and fourth harmonics have increased slightly.

Off Axis
Below is the off-axis polar map without the horn. Essentially the horn has very wide coverage unit 2kHz where it quickly narrows.

Below is the polar response with the addition of the horn.

You'll notice that the polar map has changed to orange. This is due to the dip occurring on-axis at 1.2kHz with the addition of the horn.

By 20 degrees off-axis this dip fills in. Since I'm using a normalized on-axis display setting within ARTA, the dip becomes a peak starting 20 degrees off-axis as shown by the strong vertical red lines in the polar map.
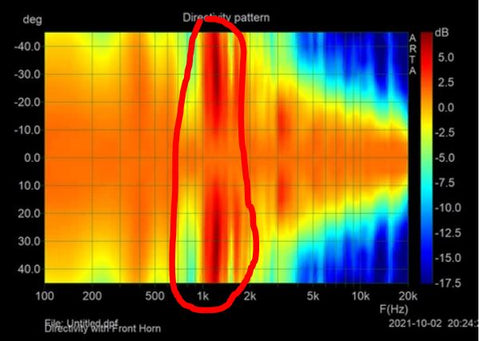
This explains the drastic change in overall color between the two maps.
Pattern Control Compared
Below is the frequency response 60 degrees off-axis with no horn.

You can observe that there is an access of energy in the 500Hz region which is +5dB higher than the output at 100Hz.
Taking the same measurement with the addition of the horn produces the following result. 
The addition of the horn clearly balances out the response leveling the output in the 500Hz region with the rest of the spectrum. The increased bass output from the horn also serves to remedy the issue.
Directly comparing the two responses is shown below.

Conclusion
The addition of the horn less offers a moderate improvement in performance both on and off-axis. The dip introduced at 1.2kHz by the addition of the horn would not be audible especially since it fills in starting 20 degrees off axis. The only question raised from this test is whether or not the horn lens could simply be replaced by straight extensions out either side of the panel. This would be much more cost effective than fabricating the horn flare geometry used on my prototype. Regardless, it's certain that there is some short circuiting of the bass and mid-bass frequencies as a result of short acoustical path from front to rear when no horn is present. Considering the amount of power required to drive these panels any increase in sensitivity is certainly welcome.