Measuring Gedlee Distortion (Gm)
In this blog post I look at measuring Gedlee Distortion (Gm) using Virtins Multi-Instrument software. To measure Gm requires the Pro version of the software which costs $229.95 USD.

Additionally, to measure Gm as a distortion sweep across the frequency spectrum requires the software add-on 'Device Test Plan' for an additional $100 USD.

Below is the Device Test Plan window which is a series of steps, row by row, that the program follows once the 'play' button is selected. The first step loads the panel settings. The second step and following are the various test tones which are generated in sequence based on a prescribed time interval. The software does not produce a sweep tone, rather, it produces static test tones in sequence and duration.

I decided to first test the Markaudio CHR120 6.5" fullrange driver using my Hypex FA123 plate amplifier. On the input side I am using my ACO Pacific 7052 mic, along with the Focusrite Scarllet Solo US. Mic Preamp. The test signal level was set to 85dB at 1m.
The results displayed are for a distortion sweep measurement on the Markaudio CHR120 6.5" fullrange driver. As you can see in the Gm panel, the value quickly gets very small starting at 500Hz.

The obvious problem is that the Gm value gets extremely small when distortion is low. Changing the vertical axis to logarithmic resolves this display issue.

For reference, below is the frequency response for the CHR-120.

I then decided to use the E1DA Cosmos ADC to measure the distortion on the Hypex FA123 (Channel 3). I simply placed alligator clips on the amplifier's output terminals to capture the results into the Cosmos ADC. The 7kHz region is only 0.000046 Gm.

However, I realized that the test panel settings provided by Virtins was plotting the Gm metric with the X-axis as a function of F1 and not F2. The correct display should have the X-axis plotted as a function of F2. So I created a new panel with Gm as a function of F2 which shifts the entire graph upwards in frequency by twice F1. This explains why the Gm distortion rises at 10kHz. I then decided to create new test tone values which rise 1/3 octave for each step. So F2 is now 1.3x that of F1. For some reason the software could not produce a Gm result above 11kHz. This may be related to the equation for Gm, looking for higher order harmonics which simply are outside the frequency range of the software.

I then decided to go back and measure the Markaudio CHR120 with the new test tones and the x-axis changed to F2. I believe I now have a close representation on the true Gm distortion sweep for the Markaudio. Gm for 11kHz is only 0.000267,

Before concluding I decided to test my tube amplifier to see how it does.

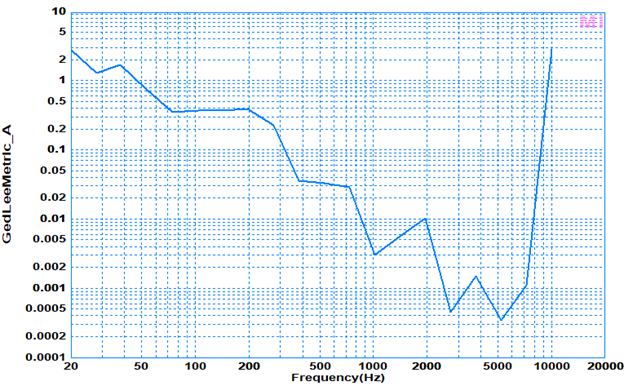
Below is the same test but displayed as THD-A. We can see that Gm is presenting a different noise profile across the spectrum compared to THD indicating that the perceptive weighting for Gm is showing us a difference between the two metrics.

The Virtins manual does a good job of explaining Gedlee Distortion and so I've pasted the User Manual section topic below.
"3.3.2.8.3.10 GedLee Metric
It has long been known that the conventional nonlinearity metrics, such as THD and IMD, don’t correlate well with human auditory perception. A number of new nonlinearity metrics have been proposed by many researchers in the past, attempting to take into account the subjective assessment in addition to the objective one. Among them, a notable one is GedLee Metric, proposed by Dr. E.R.Geddes and Dr. L.W.Lee in their paper “Auditory Perception of Nonlinear Distortion - Theory,” presented at the 115th Convention of the Audio Engineering Society, October, 2003.
VIRTINS Multi-Instrument 3.9 Manual www.virtins.com 287 Copyright © 2006-2022 Virtins Technology Virtins Technology GedLee metric (Gm) is a perceptually weighted quantitative measure of the nonlinearity of an ideal memory-less (static) nonlinear system, which has no frequency dependence or memory in time and thus has an infinite bandwidth. In such a system, the instantaneous output y is determined only by the instantaneous input x through the nonlinear transfer function T(x), i.e. y = T(x). Gm is defined by: The second derivative of T(x) corresponds to the curvature of the T(x) curve. If the system is linear, then the curve becomes a straight line and thus the curvature is zero. As a result, Gm becomes zero. Squaring the second derivative of T(x) alleviates the sign problem and makes upward and downward concave, both of which deviate from a straight line, equally weighted. By taking the second derivative of the nonlinear transfer function T(x), the metric gives more weight to higher order distortions as the second derivative increases in value according to n×(n-1) where n is the order of nonlinearity in T(x)’s polynomial expansion. This attempts to account for the masking effect of the human ear which tends to make higher order nonlinearities more audible than lower order ones. Finally, the offset and linear gain terms in T(x) are completely removed by taking the second derivative, leaving only the nonlinear distortion in Gm calculation. The squared cosine term in the above formula attempts to addresses another masking effect which tends to cause nonlinearities that occur at low signal levels to be more audible than those that occur at higher signal levels. It is unity at small values of the signal and zero at the largest ones. The product of the above two terms is then integrated along x from -1 to +1 (the normalized range of the output signal) after which the square root is taken to yield Gm. In the real world, it is difficult to find an ideal memory-less system. Thus, T(x) is frequency dependent in a real system, i.e. T(x,f). As a result, Gm(f) is also frequency dependent. However, there is no ambiguity in performing calculation if Gm is measured at a particular frequency. This is completely analogous to the case of THD. Therefore, in Multi-Instrument, Gm is measured using a sine wave as the stimulus at a particular frequency. It can be measured together with THD, THD+N, SNR, etc. Please refer to the previous THD measurement section for the selection of a proper testing frequency and window function in order to avoid or suppress the spectral leakage in FFT and obtain correct measurement results. Unlike THD, Gm takes into account the relative phase information of harmonics as well and thus it requires the software to be able to measure the relative phase of each harmonic accurately. In Multi-Instrument, to measure the phase of each harmonic, the FFT size must be set to a value greater than ½ of the Record Length, but less than or equal to 1/1 of it. MultiInstrument features a specially designed algorithm which is able to measure the phase angle of a harmonic accurately even when its amplitude is only 0.01% of that of the fundamental or the signal itself. Same as the THD measurement, it is possible to specify the frequency range and the highest order of harmonics used to calculate Gm. The highest order of harmonics allowed in Gm calculation is 100. According to the aforementioned researches by Dr. Geddes and Dr. Lee, Gm < 1.0 can be expected to yield subjective ratings of “imperceptible” and Gm < 3.0 can be expected to yield subjective ratings of “barely perceptible but not annoying”. The following two examples (see figures below) are quoted from Keith Howard’s article “Weighting Up”. The stimulus is a 1 kHz sine wave. In these two examples, the measured harmonics have the same amplitudes but different relative phases. In particular, the second example has its 3 rd, 7th, 11th, 15th and 19th harmonics’ polarities inverted (i.e. a phase difference of 180 degree) as compared to those of the first example. The phase differences result in different waveforms: the first example shows obvious cross-over distortions while the second one has obvious distortions at its peaks and troughs. In both cases, the measured THD values are the same (about 6.48%), implying that THD is not able to differentiate these two cases. On the other hand, the measured Gm values are very different: 2.22 and 0.92 respectively, illustrating that Gm places greater emphasis on the nonlinear distortion perceived at low signal levels than high ones, which is in accordance with the psychoacoustic findings as well as the fact that the signal amplitude of a music is close to the zero crossing for much of the time, with only infrequent excursions to high amplitudes. It should be noted that the phase angles displayed in the DDP array viewer (will be introduced later) in the above two examples reference to sine functions. Internally in the software, the nonlinear transfer function T(x) is expressed as a series of harmonically related cosine terms. The measured phase angles of harmonics are normalized with respect to that of the fundamental in terms of cosine functions, and the measured amplitudes of the harmonics are normalized by that of the fundamental. Gm is calculated according to its definition after these normalizations. No inter-frame average in the Spectrum Analyzer is allowed in Gm calculation. Averaging, if needed, can be done through DDP viewer. Gm can be accessed through the Derived Data Points (DDPs): GedLeeMetric_A for Channel A, and GedLeeMetric_B for Channel B. Two Panel Setting File examples can be found at: \psf\Pro\GedLeeMetric_FFT32768_SR48000_SingleChannel.psf \psf\Pro\GedLeeMetric_FFT32768_SR48000.psf 3.3.2.8.3.11 Dynamic "